In this study, the air friction from a V-shape coil bank as well as a slab coil from the coil bank was measured at a range of face velocities from 100 to 1000 FPM (0.51 to 5.08m/s) in an open environment. The angle of the V-shape’s apex was measured at 15 to 60 deg. The results were then compared with those of a slab coil. In general, higher face velocity caused higher air friction, as did increasing the apex angle’s acuteness. A visualization test showed a very different air flow direction and velocity profile on the coil’s front surface, which could explain the higher air friction from the V-shaped coil bank. These results will help improve the accuracy of fan selections in HVAC systems that feature V-shaped coil banks.
20th International Refrigeration and Air Conditioning Conference at Purdue, July 15 – 18, 2024
Jian Yu*
Super Radiator Coils, Richmond, VA 23236, USA
Tel: 804-378-1313, Fax: 804-794-7437, Email: jian.yu@superradiatorcoils.com
*Corresponding Author
1. INTRODUCTION
Many large rooftop condensers or water coolers feature V-shaped coil banks with fans installed on top of them, which pull air through the coil banks. In residential air-handling units, A-shaped coil banks are a very popular design. The air is normally pushed through the V-shaped coil bank. Both configurations intend to maximize heat transfer surface area within a limited footprint.
Standard coil performance testing is conducted so that air flow is perpendicular to the coil’s front surface. The air friction values learned from that test are then used to inform fan selection. But, in many mid-sized and large HVAC systems, coils oriented in a V-shaped configuration are very popular. In such an orientation, the air flow direction relative to the front surface of the coil may change, which could impact the air friction values in the application.
Limited research on air friction in V-shaped coil banks exists, particularly in an open space environment. Abdel et al. (2008) conducted a 2-D simulation for airside heat transfer and pressure from A-shaped coil banks within ductwork. They varied the tube pitch, row pitch and coil angle and found that at a certain apex angle, a regular, staggered-pattern tube bundle could become an inline pattern with respect to air flow, resulting in the lowest airside pressure drop in this coil bank. Yashar and Domanski (2009, 2010) used Particle Image Velocimetry to measure the air flow distribution approaching and exiting an A-shaped coil bank within ductwork. They observed a non-uniform air velocity profile along the coil surface. At the inlet closest to the base, there was almost no air flow. As condensate exited the coil bank, a large increase in air flow resistance was measured.
2. EXPERIMENTAL SETUP & MEASUREMENTS
2.1 Wind tunnel loop and test setup
All experiments were conducted in a wind tunnel, as shown in Figure 1. A variable speed blower circulates the air in the tunnel. In the wind tunnel, the air flow is controlled by a blower. The maximum volumetric air flow rate is 8,000 CFM (13,592 m3/h). The air temperature is controlled by two coils. One is for heating the air by hot water. Another is for cooling the air by chilled glycol. Humidity can be adjusted by a steam humidifier. This wind tunnel was run as an open-loop system.
The V-shaped coil bank was horizontally mounted at the inlet of the tunnel. The conditioned air was poured into the room and the room air was pulled through the coil bank. There is a baffle at the front the V-shaped coil bank to prevent the air from the wind tunnel entering directly into the coil bank.
The air nozzles in the wind tunnel’s nozzle chamber were used to measure air flow. The opening cross-section of the wind tunnel is 24” x 24” (610mm x 610mm). Transition ductwork is necessary to connect the coil or coil bank and tunnel inlet opening. The air friction, which is the pressure difference between the environment and the outlet of the coil or V-shaped coil bank, was measured at the straight section of transition ductwork. There is no fluid in the coil or coil bank. All ductwork is well insulated. The air temperature and humidity were measured at the coil outlet.
.jpg?width=1000&height=440&name=Experimental%20Study%20on%20Air%20Friction%20from%20A-Frame%20Coils%20(Final).jpg) Figure 1: Wind Tunnel System
Figure 1: Wind Tunnel System
During testing, we used one set of coils to form a V-shaped coil bank at various apex angles – two identical slab coils built with 3/8” (9.52mm) OD smooth wall copper tube and louvered AL fin with a 4-row staggered tube bundle. The coils’ fin density was 10FPI (394fin/m). The coils’ front face area is 24” x 24” (610mm x 610mm). The detailed specifications of the slab coil can be found in Table 1. The apex angle of the V-shaped coil bank was set at 15, 30, 45 and 60 deg. Different transition ductworks were designed and used in the tests due to the different opening sizes at the outlet of V-shaped coil bank.
2.2 Measurement
The air flow rate was measured by a set of flow nozzles corresponding to the air flow rate. A high accuracy differential pressure transducer (MKS 626A, ±0.25% of reading) was used to measure the pressure drop across the air flow nozzle(s). An RTD sensor installed in the ductwork after the transition ductwork was used to measure the air temperature.
Three different pressure transducers (MS-121-LCD, ±0.25%) were used to measure the pressure drop through the slab coil or V-shaped coil bank corresponding to the range of sensors. The low-pressure end of the DP sensor was connected to the port on the straight section of the transition ductwork. The high-pressure end of DP sensor was exposed to the atmosphere where there was no visible airflow. A thermocouple and a relative humidity sensor (Rotronic HygroFlex, ±0.8% RH) installed in the nozzle chamber were used to measure the air temperature and humidity for air flow rate calculation. The air pressure was the atmospheric pressure. All sensors were calibrated before the tests. In this study, the face velocity (FV) for a slab coil is defined as:

where the SFCM is the volumetric air flow rate under the ASHRAE standard condition. FH is the fin height. FL is the fin length. For a V-shaped coil bank, the Face Velocity (FV) is one-half of Equation 1’s value. The air friction (AF) is the air-side pressure drop across the coil or coil bank.
2.3 Test Conditions & Parameters
The V-shaped coil bank has two identical slab coils mounted on the triangle frame. The apex angle of the V-shaped coil bank was controlled by the triangle frame. The bottom opening was connected to the wind tunnel opening with a transition ductwork. The V-shaped coil bank was in an air free flow environment. The air was pull through the coil into the wind tunnel ductwork. The face velocity of the airflow ranged from 100 to 1000 FPM (0.51 to 5.08m/s). The air outlet temperature was controlled at 68F (20°C). No water was in the coils. The apex angle is from 15 to 60 deg. The pressure drop through a V-Shaped coil bank was measured by a differential pressure transducer between the atmosphere and the coil outlet.
3. RESULTS & DISCUSSION
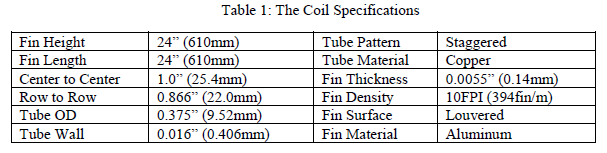
The air friction of one of the two slab coils from the V-Shaped coil bank was tested under the same conditions. The slab coil was mounted on the same location at the wind tunnel as the V-Shaped coil bank. Under such conditions, the main airflow direction at the back side of the coil should be perpendicular to the coil face. The majority of tube bundle should remain in a staggered pattern with respect to airflow. The measured air friction vs the face velocity was plotted in Figure 2. As shown in the figure, the air friction is the power function of the face velocity.
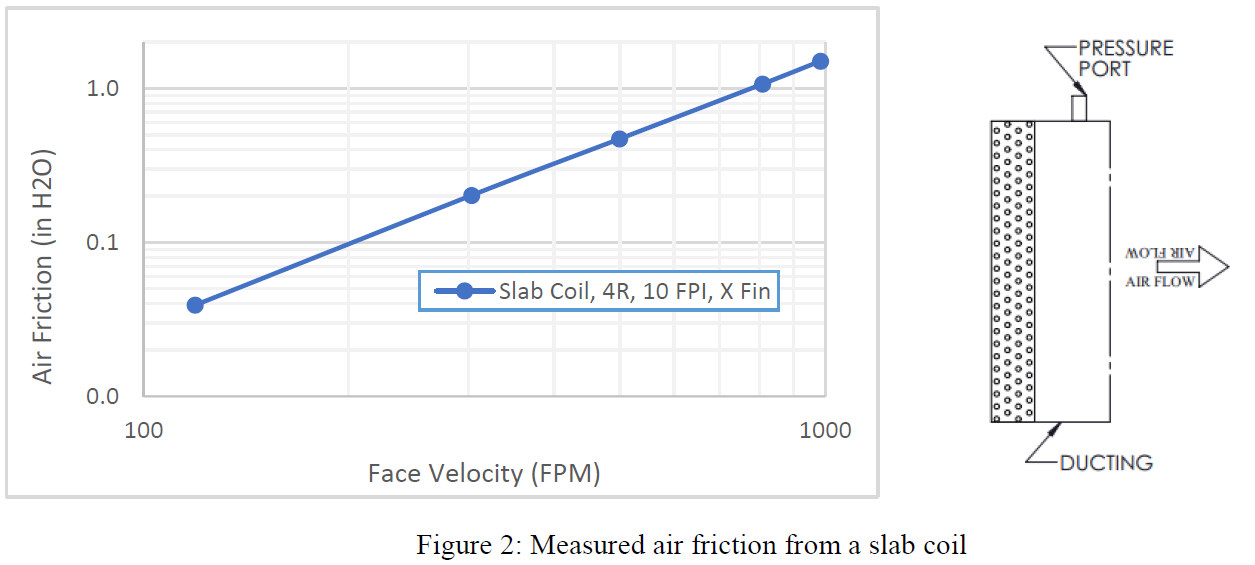
The air friction of the V-Shaped coil bank, which consisted of two slab coils, was measured at different apex angles. The air was pulled through the coil. The measured air friction vs face velocity under four different apex angles is plotted in Figure 3. The air friction in all cases was the power function of the face velocity. The higher the face velocity, the higher the air friction.
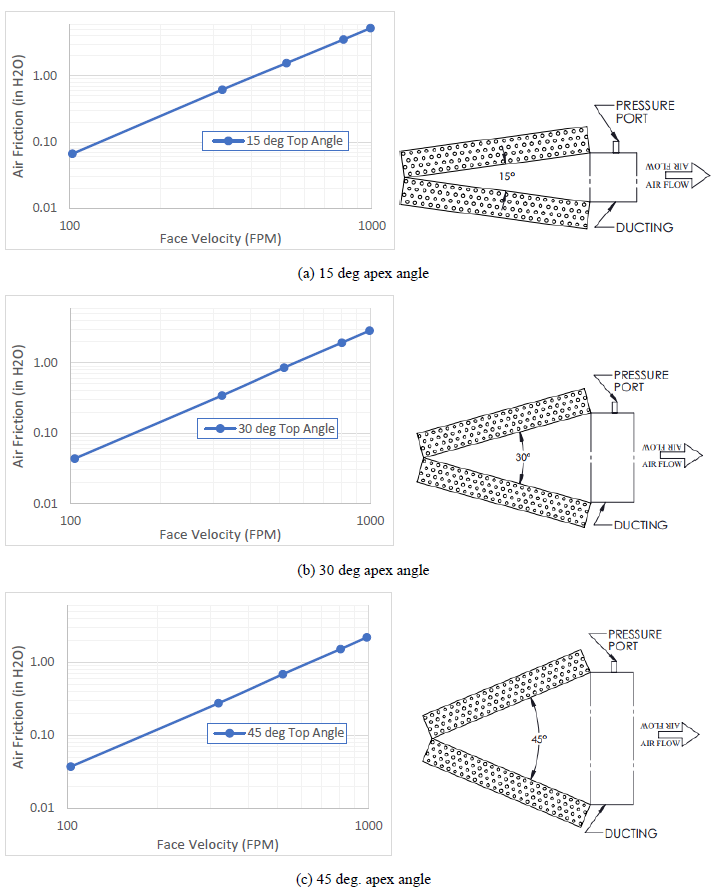
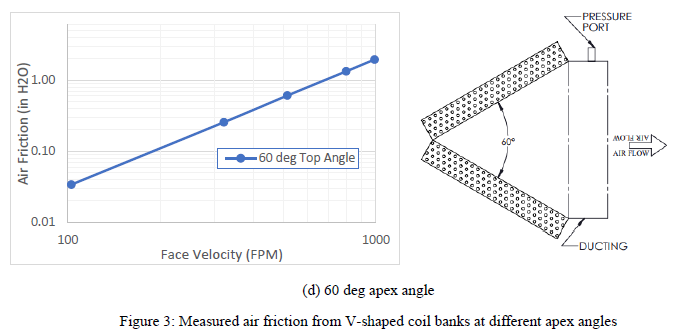
Figure 4 shows the comparison of air friction for all test data from V-Shaped and slab coils. Underpull-through airflow conditions, the slab coil had the lowest air friction. As the apex angle of the V-Shaped coil bank decreased, the air friction increased. As shown in this figure, the air friction for the V-Shaped coil bank with a 15 deg. apex angle was much higher than the other cases.
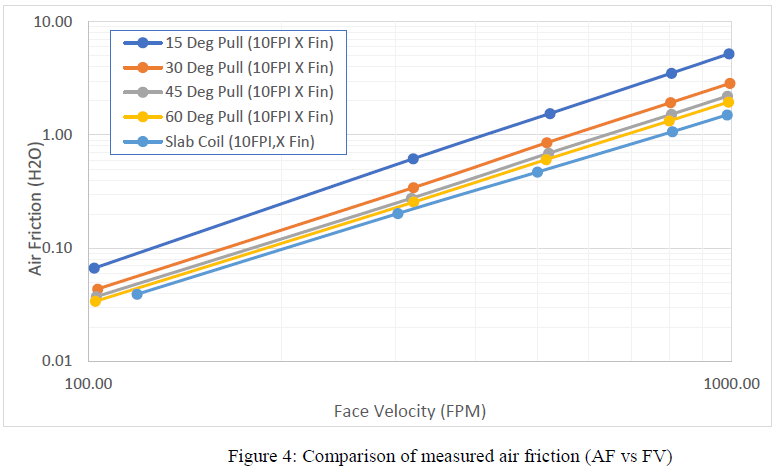
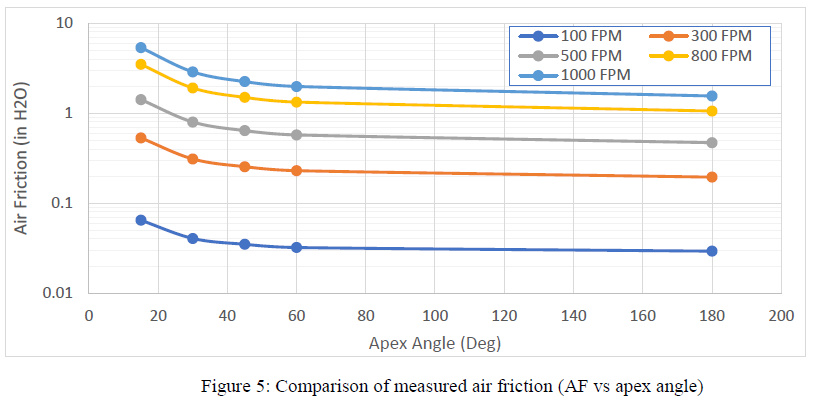
The correlation on AF vs FV for each V-Shaped coil bank was developed from the above test data. Using these correlations, the air frictions at 100, 300, 500, 800 and 1000 FPM (0.51, 1.52, 2.54, 4.06, 5.08 m/s) were calculated and plotted in Figure 5. The impact of apex angle on the air friction at each face velocity is shown in this figure. The slab coil was treated as a coil with a 180 deg. apex angle. From this figure we can see that at a face velocity of 300 FPM (1.52m/s), the air friction was over 0.5” H2O (124.5Pa) for the V-Shaped coil bank with a 15 deg. apex angle. When the apex angle was increased to 30 deg., the air friction was about 0.3” H2O (74.7Pa). While, for the slab coil, the air friction was only 0.2” H2O (49.8Pa). This means that the air friction observed at a 15 deg. apex angle V-shaped coil bank was 2.5 times greater than that of the slab coil at a face velocity of 300 FPM (1.52 m/s).
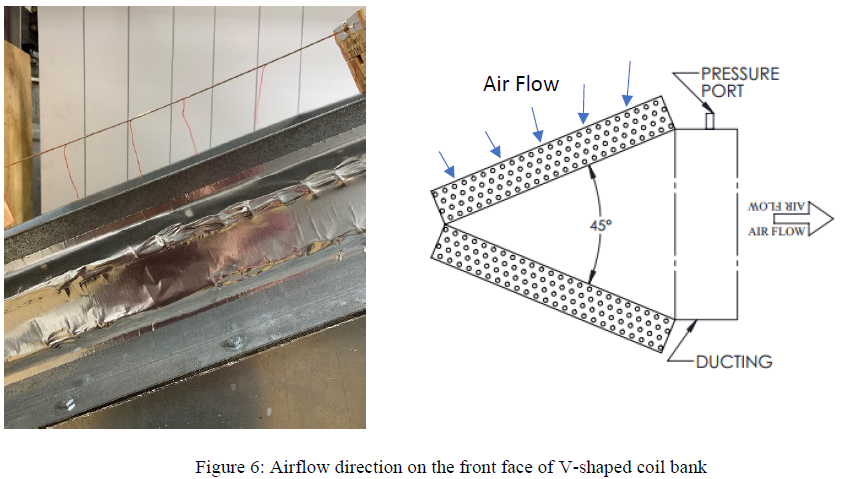
To investigate the reason for the air friction increasing due to the apex angle, a visualization test was conducted to verify the airflow direction and distribution on the front surface of the V-shaped coil bank. The vertical black line on the white board shows the gravity direction. Several thin strings were hung on a small rod to indicate the airflow direction. When the air passed though the strings, the strings followed the airflow direction.
Figure 6 shows the airflow direction near the coil’s front face at a face velocity of 500 FPM (2.54 m/s). It is clear that the air flow direction near the top of the V-shaped coil bank is perpendicular to the coil’s surface. Near the opening area, the air flow direction changes to the opposite direction relative to the main airflow at the outlet of the V-shaped coil bank. From our observation, we can also confirm that the air velocity near the opening area is much higher than that of the top area. The air flow distribution is not uniform at all, which could cause the coil performance to be poorer than that that of the slab coil.
In ASHRAE standard 33 (2016) and ARI standard 410 (2001), the coil performance test should be conducted conditions in which airflow is perpendicular to the coil’s surface with uniform air distribution across the coil’s surface. These assumptions are also applied when developing coil rating models and programs. All tests for the air-side heat transfer coefficient must adhere to the ASHRAE and AHRI standards. The V-shaped coil bank causes different airflow direction and airflow profile on the coil’s surface. As a result, we should question the efficacy of directly applying coil rating results to a V-shaped coil bank.
A very clear example can be found in Figure 5. At 500 FPM (2.54 m/s) face velocity, the air friction for the slab coil was about 0.47” H2O (117.1 Pa). If we put the same coils in a V-Shaped coil bank with a 30 deg. apex angle, the air friction of the V-Shaped coil bank increased to 0.8” H2O (199.3 Pa) at the same face velocity. If fan selection was based on the air friction values of the slab coil, the actual face velocity on the V-Shaped coil bank with the same fan can only be 345 FPM (1.75 m/s). As a result, the actual airflow could be fall short of predictions by as much as 30%.
CONCLUSIONS
The air friction of a V-shaped coil bank with a set of identical slab coils was tested at different face velocities and different apex angles. The air friction observed in the V-shaped coil bank was higher than that of the slab coil and increased with the air’s face velocity. The air friction from the V-shaped coil bank also increased as the apex angle decreases. The visualization test showed that the airflow direction is not perpendicular to the coil’s surface and the air velocity profile was not uniform across the coil’s surface.
NOMENCLATURE
REFERENCES
AbdelAziz, O., Singh, V., Aute, V and, Radermarcher, R. (2008). A-Type Heat Exchanger Simulation Using 2-D CFD for Airside Heat Transfer and Pressure Drop, Int. Refrigeration and Air-Conditioning Conference at Purdue.
ARI Standard 410 (2001). Forced-Circulation Air-Cooling and Air-Heating Coils, ARI, VA, USA
ASHRAE Standard 33 (2016). Method of Testing Forced-Circulation Air-Cooling and Air-Heating Coils, ASHRAE, GA, USA
Yashar, D.A. and Domanski, P.A. (2009). Particle Image Velocimetry Measurements and CFD-Based Predictions of Air Distribution at Evaporator Inlet and Outlet, (ARTI Report NO. 07010-01; 67 p.)
Yashar, D.A. and Domanski, P.A. (2010). Air Flow Distribution through an A-Shaped Evaporator under Dry and Wet Coil Conditions, Int. Refrigeration and Air-Conditioning Conference at Purdue.