This paper was originally published for the 20th International Refrigeration and Air Conditioning Conference at Purdue University, July, 2024.
Authors: Tyler Stusynski1, Jian Yu2*
1Super Radiator Coils Chaska, MN, USA
Tel: 952-556-3337, Fax: 952-556-3341, Email: tyler.stusynski@superradiatorcoils.com
2Super Radiator Coils Richmond, VA, USA
Tel: 804-378-1313, Fax: 804-794-7437, Email: jian.yu@superradiatorcoils.com
© 2024-2025 Super Radiator Coils Limited Partnership
Abstract
When moist air passes through a cooling coil, the potential exists for that moisture to condense on the coil's surface. The temperature at which that occurs is the condensing temperature or the dew point temperature. The dew-point temperature is determined by air pressure and humidity based on thermodynamic theory. The condensate, which is condensed water vapor, usually remains on the cold surface for some amount of time before being removed by gravity, the air stream, or both. The temperature of that condensate may not be the same as the dew-point temperature. In formulas found in the 2020 ASHRAE handbook – “HVAC Systems and Equipment,” condensate temperature is assumed to be equal to the wet-bulb temperature at the leaving condition. In this study, a 12-row cooling coil was tested under fully wet surface conditions. The condensate temperature profile along the air-flow direction as well as the average condensate temperature were measured under different inlet humidities and face velocities. The test results showed that the condensate temperature was higher than the wet-bulb temperature. Factors that contributed to this included air temperature, inlet humidity, air velocity, water temperature, and water velocity.
1. Introduction
Air cooling with or without dehumidification is commonly used in many residential, commercial, and industrial systems, such as HVAC, data center cooling, environmental chambers, food storage/preparation, etc. When air is cooled below its initial dew point, latent heat is removed through condensation. Most conventional systems combine both sensible and latent processes using a single device, although systems that separate the sensible and latent processes exist. Tube and plate-fin heat exchangers are widely used in such applications, and are a critical component in conventional system design.
The formula to calculate the total air-side cooling load can be derived from a mass and energy balance and is typically defined as Equation (1).
𝑞 = 𝑤𝑎[ℎ𝑎,𝑖𝑛 − (ℎ𝑎,𝑜𝑢𝑡 + (𝑊𝑖𝑛 − 𝑊𝑜𝑢𝑡)ℎ𝑐,𝑜𝑢𝑡)] (1.)
The impact of the condensate enthalpy on the total cooling load varies with conditions and its significance increases proportional to the condensate rate. For applications with very low latent loads, the condensate enthalpy is often neglected. While acknowledging that the final condensate temperature is subject to significant variations, ASHRAE (2020) suggests assuming the leaving condensate temperature to be the same as the leaving wet-bulb temperature and calculating the condensate enthalpy using Equation (2).
 (2.)
(2.)
The performance of wet surface tube and plate-fin heat exchangers has been studied extensively by many researchers, but little research investigating the leaving condensate temperature has been conducted. The objective of this study is to quantify the variation in leaving condensate temperature of a plate-fin heat exchanger operating under various conditions.
2. Experimental Setup
2.1 Test Facility
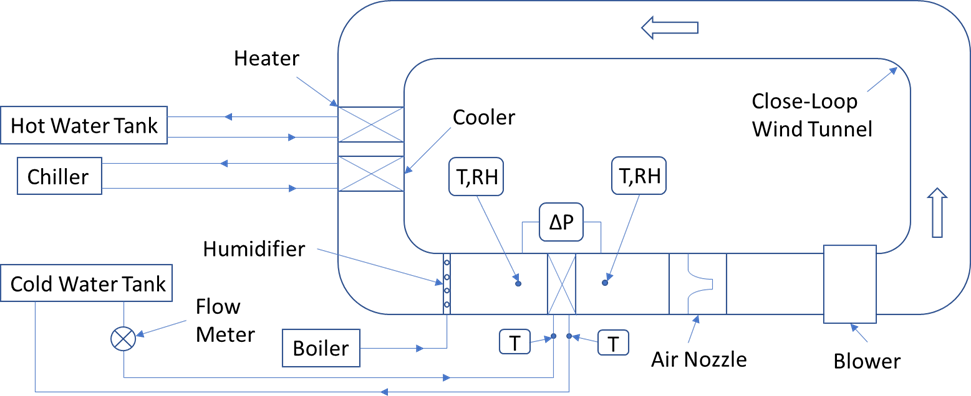
The condensate temperature was measured by installing a heat exchanger in a closed-loop wind tunnel as shown in Figure 1. The air flow was controlled by a variable speed blower that circulates the air in the tunnel. The flow direction was perpendicular to the front face of the heat exchanger. The inlet air temperature was controlled by two heat exchangers. One was used to heat the air using hot water supplied by a hot water storage tank. The second was used to cool the air using propylene glycol supplied by a chiller. The inlet humidity was adjusted by a steam humidifier.
The wind tunnel was equipped with RTD sensors to measure the inlet and outlet temperatures of the air and cold water. The humidity of the air was measured at the inlet and outlet of the test section using relative humidity sensors. The air flow rate was measured in the nozzle chamber using air nozzles. A differential pressure transducer was used to measure the pressure loss on the air side. A turbine flow meter was used to measure the water’s flow rate. The wind tunnel was heavily insulated to prevent heat loss. A drain pan was specially designed to collect the condensate while preventing air bypass in the flow direction. It was also designed to prevent air entering the wind tunnel through the condensate collection piping. All sensors and meters were calibrated according to ASHRAE standards.

Figure 1: Closed-loop wind tunnel schematic
2.2 Measurement
The air flow rate was measured by a set of flow nozzles corresponding to the air flow rate. A high accuracy differential pressure transducer (MKS 626A, ±0.25% of reading) was used to measure the pressure drop across the nozzle(s). The inlet air temperature was measured using an RTD sensor with an accuracy of ±0.05°F (±0.03°C). The outlet air state was measured in the nozzle chamber. The outlet air temperature was measured using a T-type thermocouple with an accuracy of ±0.05°F (±0.03°C). The inlet and outlet humidity were measured using RH sensors with an accuracy of ±0.8%. Three different pressure transducers (MS-121-LCD, ±0.25%) were used to measure the air-side pressure drop through the heat exchanger. The drain pan was partitioned into six sections, each consisting of two heat exchanger rows. The condensate leaving each drain pan section was measured using T-type thermocouples. The overall average condensate temperature was also measured using a T-type thermocouple.
2.3 Heat Exchangers
In this study, one plate-fin heat exchanger was tested at various inlet humidities and air velocities. The test unit was constructed of copper tubes and aluminum fins. Detailed specifications are listed in Table 1.

2.4 Testing Procedure
All tests were conducted in the SRC wind tunnel lab according to. ANSI/ASHRAE Standard 33-2016.All sensors and meters were calibrated according to ASHRAE standards every 12 months. The inlet air temperature target was 92 °F (33.3 °C), and the inlet humidity range was from 40% to 80% relative humidity. Air frontal velocities ranged from 250 to 350 ft/min (1.27-1.78 m/s). The inlet water temperature target was 52°F (11.1°C). Water flow rates ranged from 30 to 49 gal/min (113.6-185.5 L/min). The water temperature and flow rates were selected to ensure the fin surface was fully wet. Detailed test conditions are specified in Table 2. Data from each condition was continuously logged for the duration of the test and ran until stabilized to a steady state condition. Steady state was defined as a 15-minute interval where the inlet/outlet temperatures of the air and water were constant within ±0.2°F (±0.1°C), and the inlet/outlet RH were constant within ±2%. The result data for each test are the average for the 15-minute interval. After a steady state condition was achieved, the condensate was collected from the outlet of the drain pan into a container over a 10-minute period. The condensate was weighed, and an average condensate flow rate was calculated.

2.5 Model
Measuring airside parameters within the heat exchanger core was not part of the scope of this study. Instead, a heat exchanger model using a tube-by-tube approach was used to compare the experimental data. Heat transfer for each tube was calculated using an effectiveness-NTU method. The internal heat transfer coefficients were calculated using the Colburn-j heat transfer factors described in AHRI Standard 410-2023. External heat transfer coefficients based on prior test results were initially used to validate the test results in this study. Small adjustments were made to the external HTC to match the airside leaving conditions for each test point. The condensate removed from the air at each location had an assumed leaving temperature equal to the local leaving wet bulb temperature. The model did not attempt to predict the path of the condensate after it was removed from the air, which is an important distinction when comparing to the test results.
3. Results and Discussion
Table 3 shows a summary of the test results. The measured condensate temperature was higher than the leaving wet bulb temperature for all conditions. The difference between the measured condensate temperature and the leaving air wet bulb temperature was larger for the high inlet humidity conditions compared to the low inlet humidity cases. The test conditions with 80% RH had a higher average condensate temperature compared to the 40% RH test conditions.


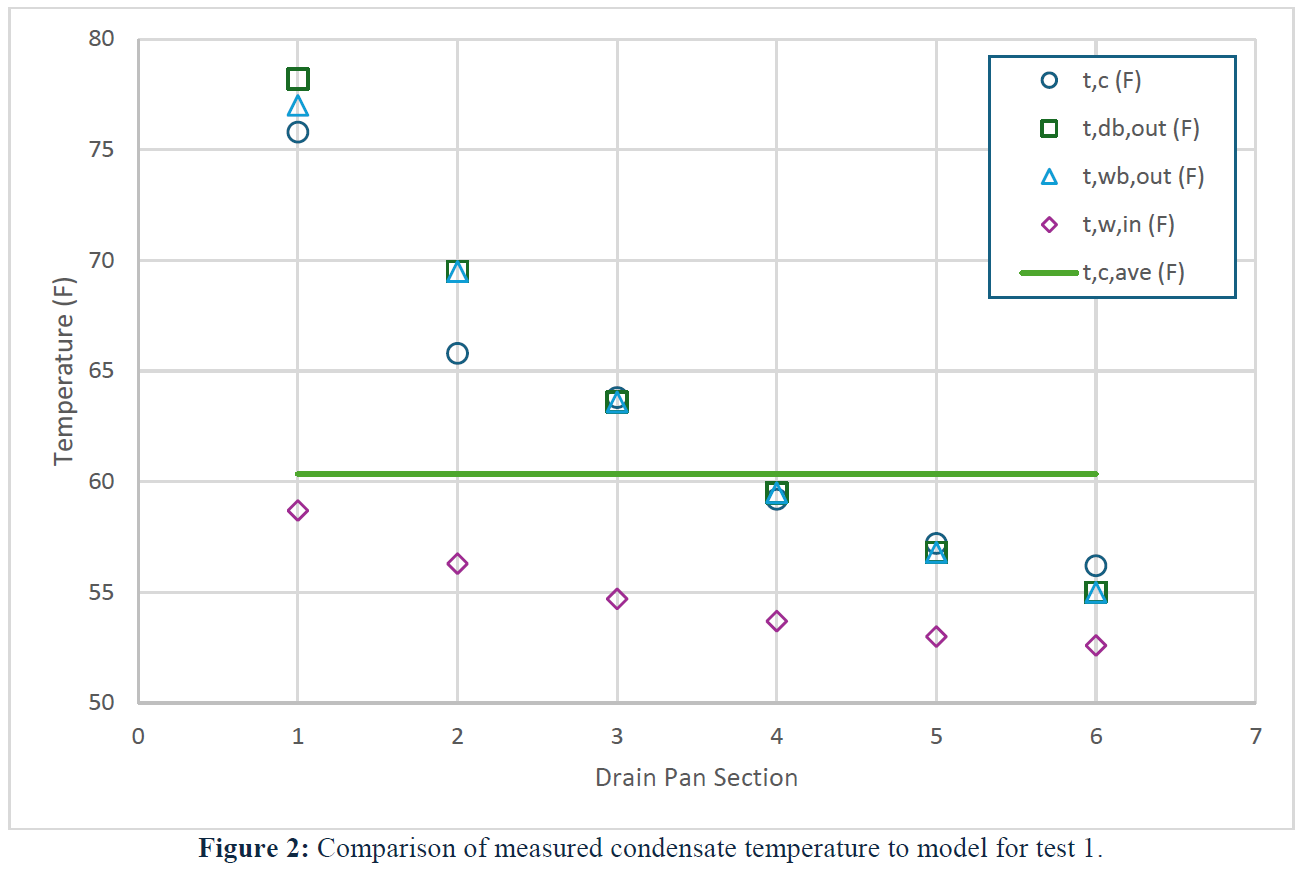
The condensate temperature at each drain pan section was compared to several parameters using output results from the heat exchanger model. Figure 2 shows a comparison of the condensate temperature to the theoretical dry bulb, wet bulb, and inlet water temperatures for test condition 1. Drain pan section 1 corresponds to rows 1 and 2 of the heat exchanger relative to the entering air side. The condensate temperature followed the general trend of the leaving air wet bulb temperature at each section. In sections 1 and 2, the measured condensate temperature was lower than the predicted leaving wet bulb temperature. The condensate temperature was within ±0.3°F (0.2°C) of the predicted wet bulb in sections 3 and 4. Sections 5 and 6 corresponding to the last four HX rows had condensate temperatures higher than the predicted wet bulb by 0.4°F (0.2°C) and 1.2°F (0.7°C), respectively.
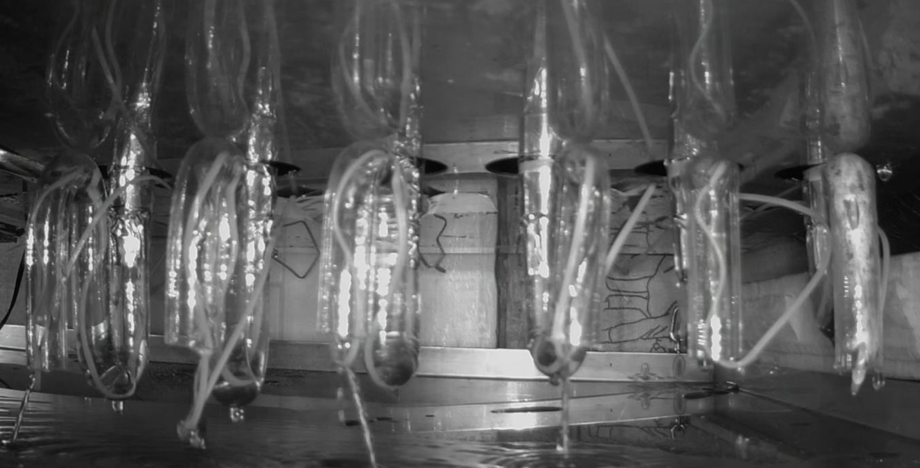
The mass flow rate of condensate in each drain pan section was not measured, but a camera was installed during the tests to examine the behavior. Based on visual examination of the video from test 1 (Figure 3), it appeared that section 1 of the drain pan had the lowest condensate flow rate, with section 2 having only a slightly higher flow rate. Sections 4 and 6 seemed to have similar flow rates and appeared to be the highest. The flow rates of sections 3 and 5 were similar and visually appeared to be closer to the flow rates of sections 4 and 6. The air flow direction in the condensate collection images is right to left. The heat exchanger model predicted the majority of condensate would be removed in sections 1 (35.4%) and sections 2 (26.0%).
A summary of the predicted condensate flow rates from the model is shown in Table 4. Using the condensate flow rates and temperatures from the model, mass weighted average condensate temperatures for each condition were calculated and are shown in Table 3. For condition 1, the measured condensate temperature 60.3°F (15.7°C) was significantly lower than the predicted average condensate temperature 68.6°F (20.3°C). It is likely that the condensate removed from the air in each section moved along the air flow direction and was further cooled before reaching the drain pan.


Figure 3: Condensate collection from condition 1.

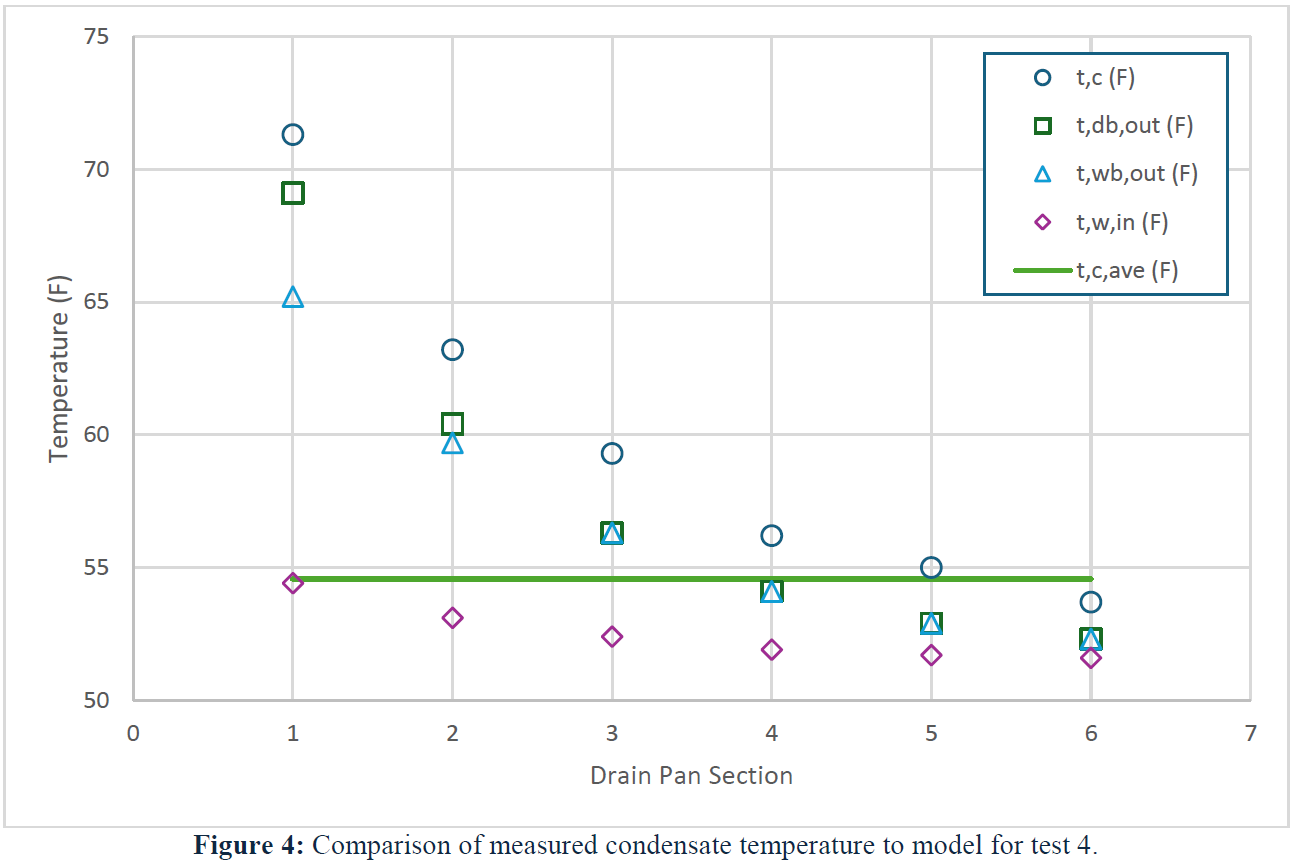
The 40% RH and 250 ft/min (1.27 m/s) frontal velocity case showed a similar trend with the condensate temperature decreasing along the air flow direction, except the condensate temperature was always higher than the predicted leaving wet bulb (Figure 4). Section 1 had the largest difference between the condensate temperature and the predicted leaving wet bulb temperature of 6.1°F (3.4°C). Section 6 had the smallest difference which was 1.4°F (0.8°C). The average condensate temperature – 54.6°F (12.6°C) – was significantly lower than the condensate collected in sections 1-4, and close to the temperature of the condensate collected in sections 5 and 6. The measured average was much lower than the overall section average temperature of 59.8°F (15.4°C).
This indicated that the majority of condensate collected in the drain pan was from the leaving air side of the heat exchanger. From the visual examination of test 4, the highest flow rate appeared to be from section 6 with the second highest flow from section 4 (Figure 5). Sections 1, 3 and 5 had very little flow rate. The flow rate in section 2 was similar to section 4 but appeared to be slightly lower. For this condition, the measured condensate temperature – 54.6°F (12.6°C) – was also significantly lower than the predicted average condensate temperature of 58.5°F (14.7°C). The theory suggests that most of the condensate should be removed from the air in the first half of the heat exchanger, but, at this condition, it is also likely that the condensate moves along the air flow direction before exiting the heat exchanger.
4. Conclusion
A plate-fin heat exchanger was tested under cooling and dehumidifying conditions at different frontal velocities and inlet humidities. For all test conditions, the measured condensate temperature was higher than the leaving wet bulb temperature. The average condensate temperature and profile along the flow direction was affected by the inlet humidity. The temperature profile in the high humidity conditions followed closely to that of the local leaving wet bulb temperatures, and the average temperature tended towards the condensate collected in the middle of the heat exchanger. In the low humidity conditions, the local condensate temperature was significantly higher than the model predicted leaving wet bulb temperatures, and the average temperature tended towards the condensate collected at the leaving side of the heat exchanger. The visual data from the condensate collection pan indicated that the condensate moves along the air flow direction before exiting the heat exchanger.
Nomenclature
Cρ - specific heat (Btu/lb-°F)
FV - frontal velocity (ft/min (m/s))
h - enthalpy (Btu/lb (kJ/kg))
P - pressure (psia (kPa))
q - heat capacity (Btu/hr (kW))
T - temperature (°F)
V’ - volume flow rate (gal/min (L/min))
W - humidity ratio (lbw/lba (kgw/kga))
w - mass flow rate (lb/h (kg/h))
ϕ - relative humidity (%)
Subscript
a - air
c - condensate
db - dry bulb
wb - wet bulb
w - water
References
AHRI (2023). 2023 Standard for Performance Rating of Forced-circulation Air-cooling and Air-heating Coils. Arlington, VA: AHRI.
ANSI/ASHRAE (2016). ANSI/ASHRAE Standard 33-2016 Methods of Testing Forced-Circulation Air-Cooling and Air-Heating Coils. Atlanta, GA: ASHRAE.
ASHRAE (2020). Handbook – HVAC Systems and Equipment (2020 ed.). Atlanta, GA: ASHRAE.


